Suspicious metrics
The Suspicious Metrics feature button appears in the main menu. Pressing this button will open the suspicious metrics panel. Compare User Controls Legend. This feature will find the suspicious metrics in a code base and provides options that can be clicked to highlight high-risk files directly in the map that probably have a limited maintainability.
It compares the values of certain metrics from the loaded cc.json file with metric values of 241 Open Source Java projects. Based on this data suspicious, inconspicuous and untracked metrics are identified and corresponding suggestions can be clicked (see following Screenshot) to automatically view them in the map.
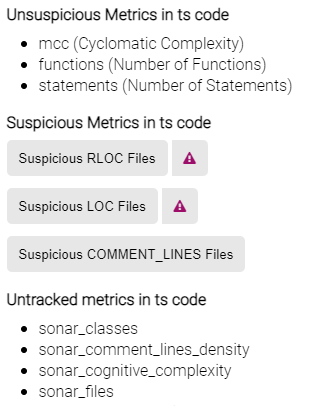
The suspicious metrics in the shown screenshot provide buttons for three metrics to be clicked for visualizing affected code files. The small warning icon button can also be clicked. It expresses that there are some files that are considered as outliers in terms of statistically significant high metric values
Be aware that metrics for other programming languages might not be comparable to Java Reference metric values. Though, it can give you a feeling about the code quality in code bases composed with other programming languages. The underlying approach is based on the work of Alves et al.