User Controls
The controls that are available to you are:
| # | Type | Action |
|---|---|---|
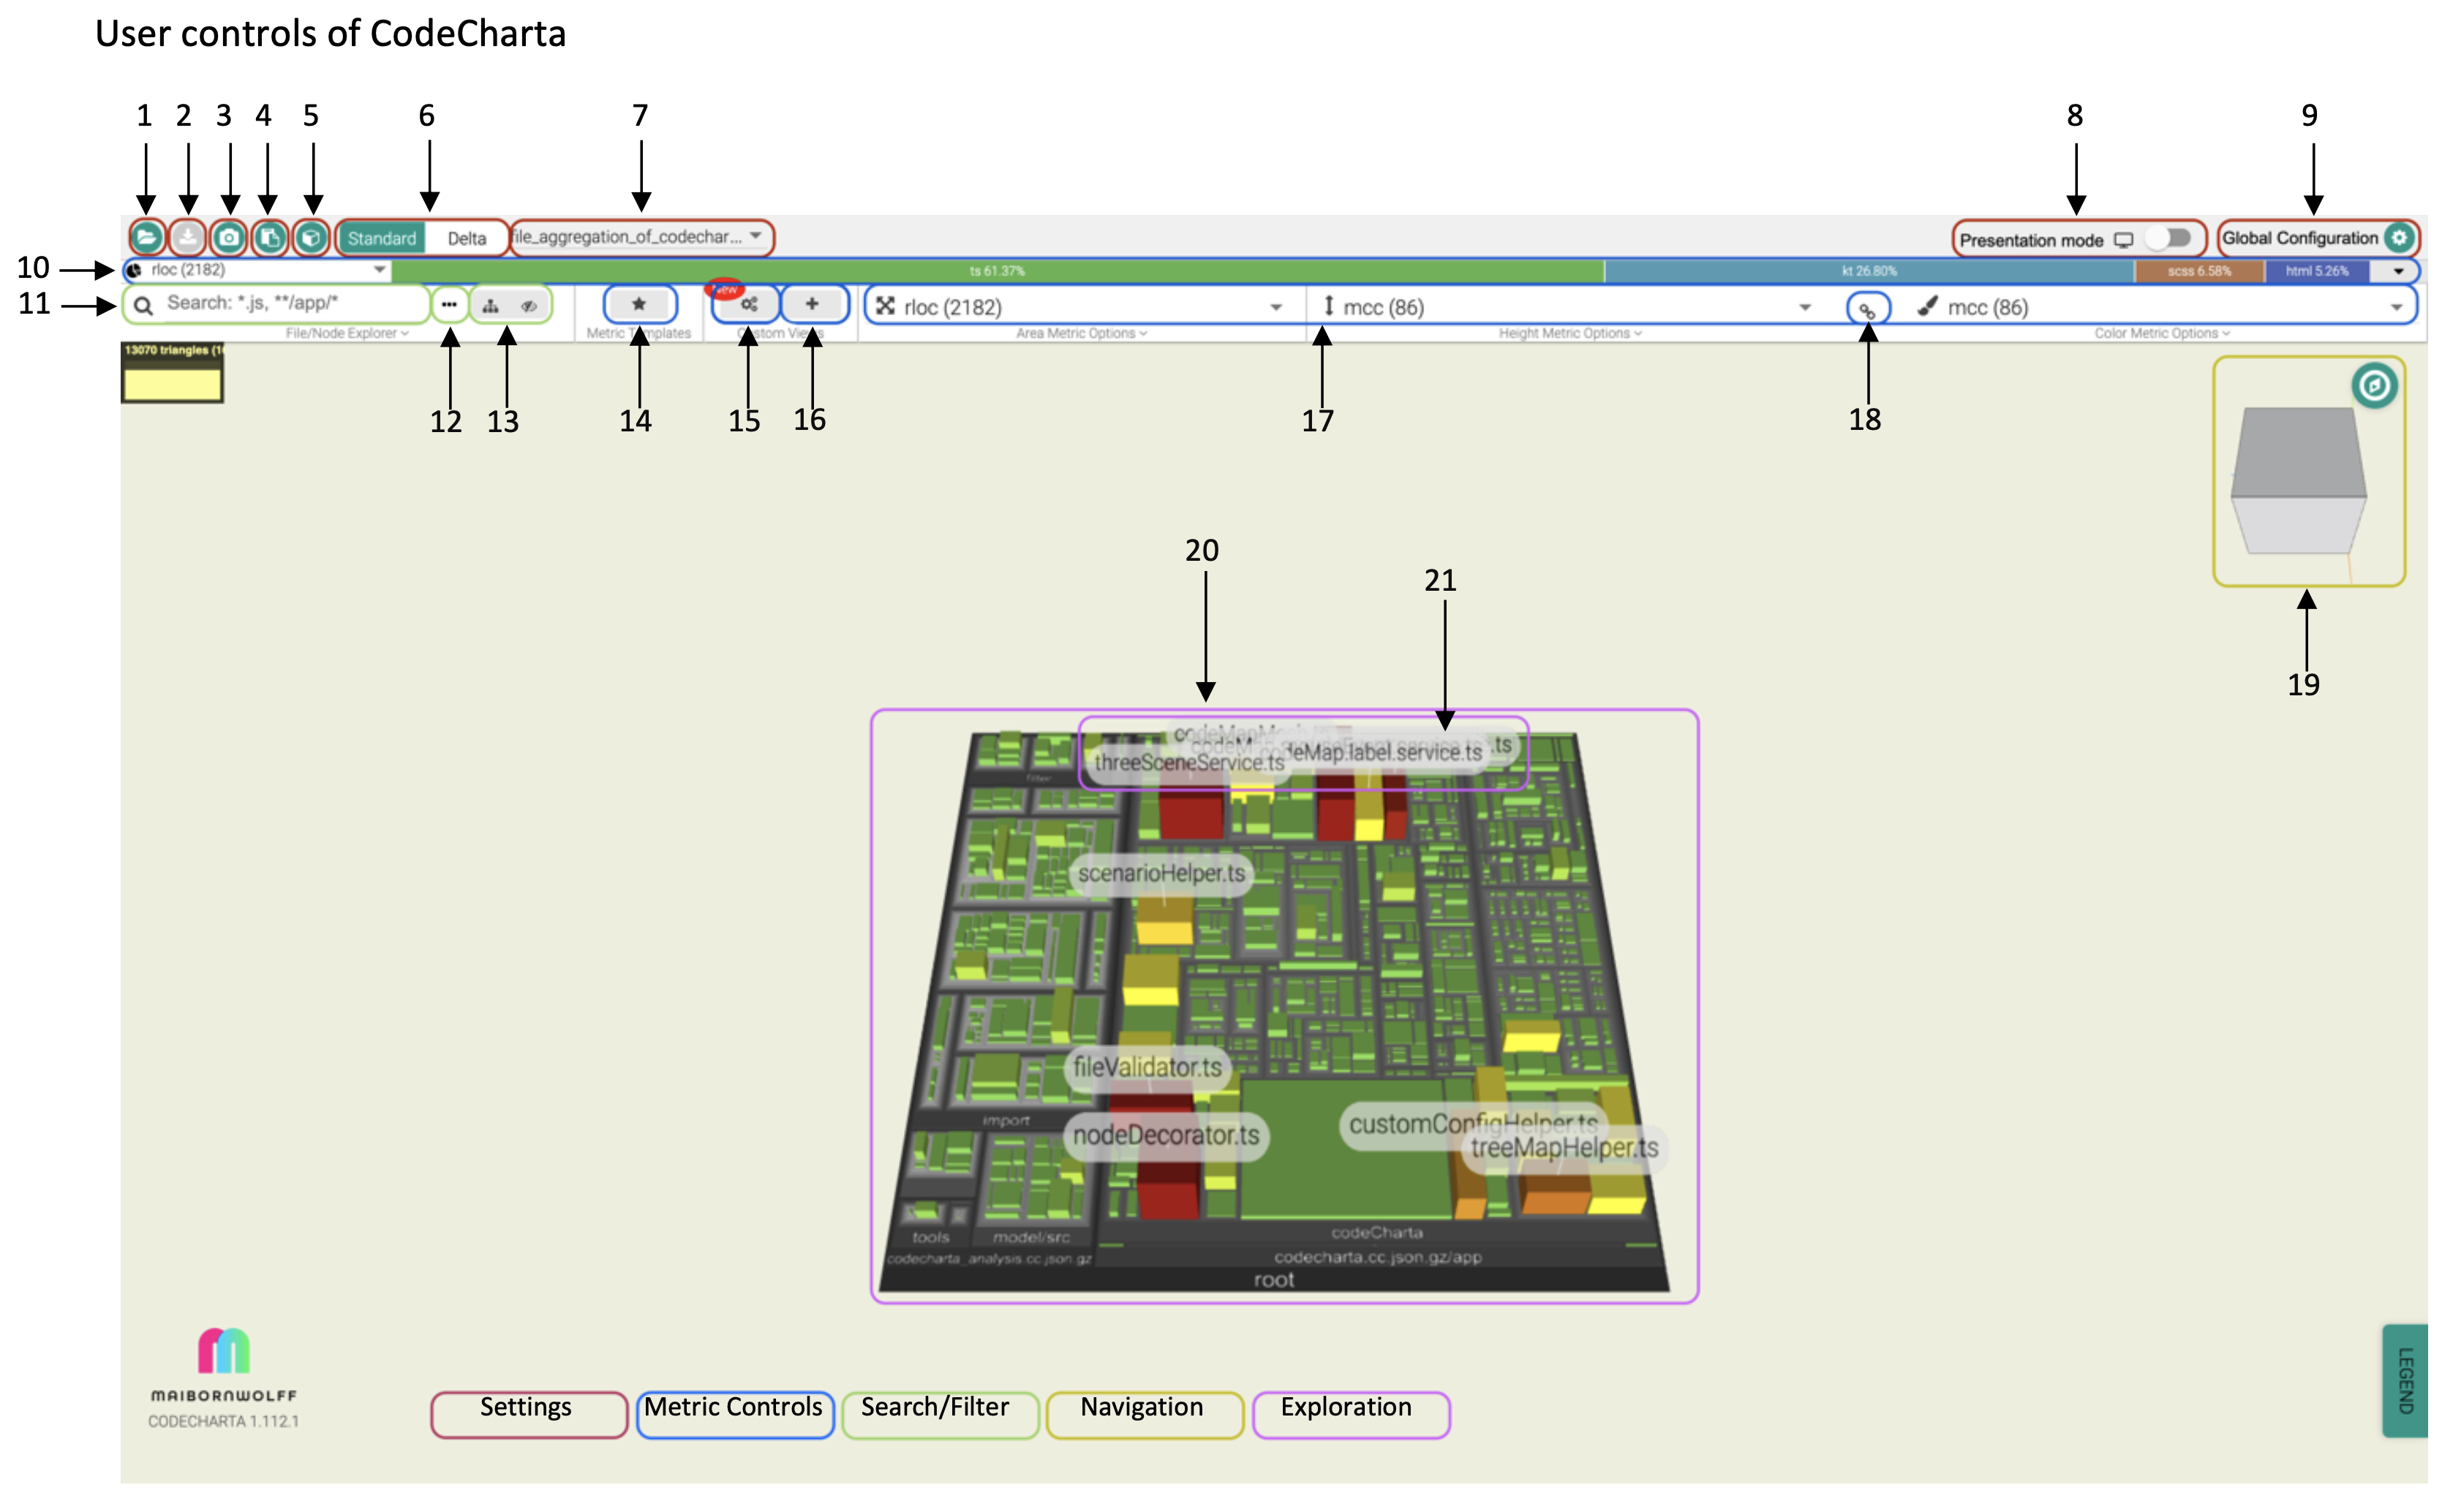
| 1 | Settings | Load cc.json map or multiple maps (hold shift). |
| 2 | Settings | Export screenshot as a file. |
| 3 | Settings | Copy the names of files with highest metric values to clipboard. |
| 4 | Settings | Download model as file for 3D-printing. |
| 5 | Settings | Resets the uploaded maps, selected metrics and settings to default. |
| 6 | Settings | Switch between showing maps in standard mode or seeing the delta between two maps, provided you have loaded multiple maps. |
| 7 | Settings | Select the map(s) being shown. |
| 8 | Settings | Turn on/off presentation mode. Beneficial when using a projector. |
| 9 | Settings | Global settings like background color, map layout, quality and experimental features. |
| 10 | Metric Controls | The distribution bar shows the distribution of a metric by file extensions. |
| 11 | Search/Filter | Search for buildings .gitignore style. |
| 12 | Search/Filter | Hide/exclude the buildings from the search result. Hidden buildings are flattened in the map, excluded buildings are no longer visible. Useful if you have lots of vendor code in your map. |
| 13 | Search/Filter | Switch between the treeview or see the hidden and excluded buildings. The latter menus can be used to restore these buildings again. |
| 14 | Metric Controls | Select a scenario, which changes multiple metrics at once. |
| 15 | Metric Controls | Save, load and manage individual configurations of the selected map. Learn more about this feature here. |
| 16 | Metric Controls | Add the current view of the map as a custom configuration. |
| 17 | Other | Show the suspicious metrics menu, which provides presets for metrics that are comparatively high in the currently loaded map. Learn more about this feature here. |
| 18 | Other | Show the risk profile, which gives a quick overview over about the complexity of the codebase. Learn more about this feature here. |
| 19 | Metric Controls | Use the metric bar to select a metrics for the buildings area, height and color. Click on the arrow to change metric details such as color range. If your map provides them, this also displays ‘edge metrics’ which are edges between buildings. |
| 20 | Metric Controls | Link height and color metric to be the same metric. |
| 21 | Other | Click on any side or edge of the Viewcube to quickly change the camera perspective or reset the view by clicking the compass icon. |
| 22 | Exploration | Explore metrics for each building. Hover over the building to see its name and metric displayed in the metric bar. Click on it to view additional details. If you have imported sonar metrics, buildings can also be double clicked to see sonar details. |
| 23 | Exploration | The tallest buildings automatically gets a label. You can enable/disable this or change the number of buildings to get a label in the height metric details. |
| 24 | Other | Open the legend of the map. This shows the full names for the selected metrics, a link to a source for their definition, as well as which color represents which range of values. Exporting a screenshot while the legend is opened will include the it in the screenshot. |