Suspicious metrics
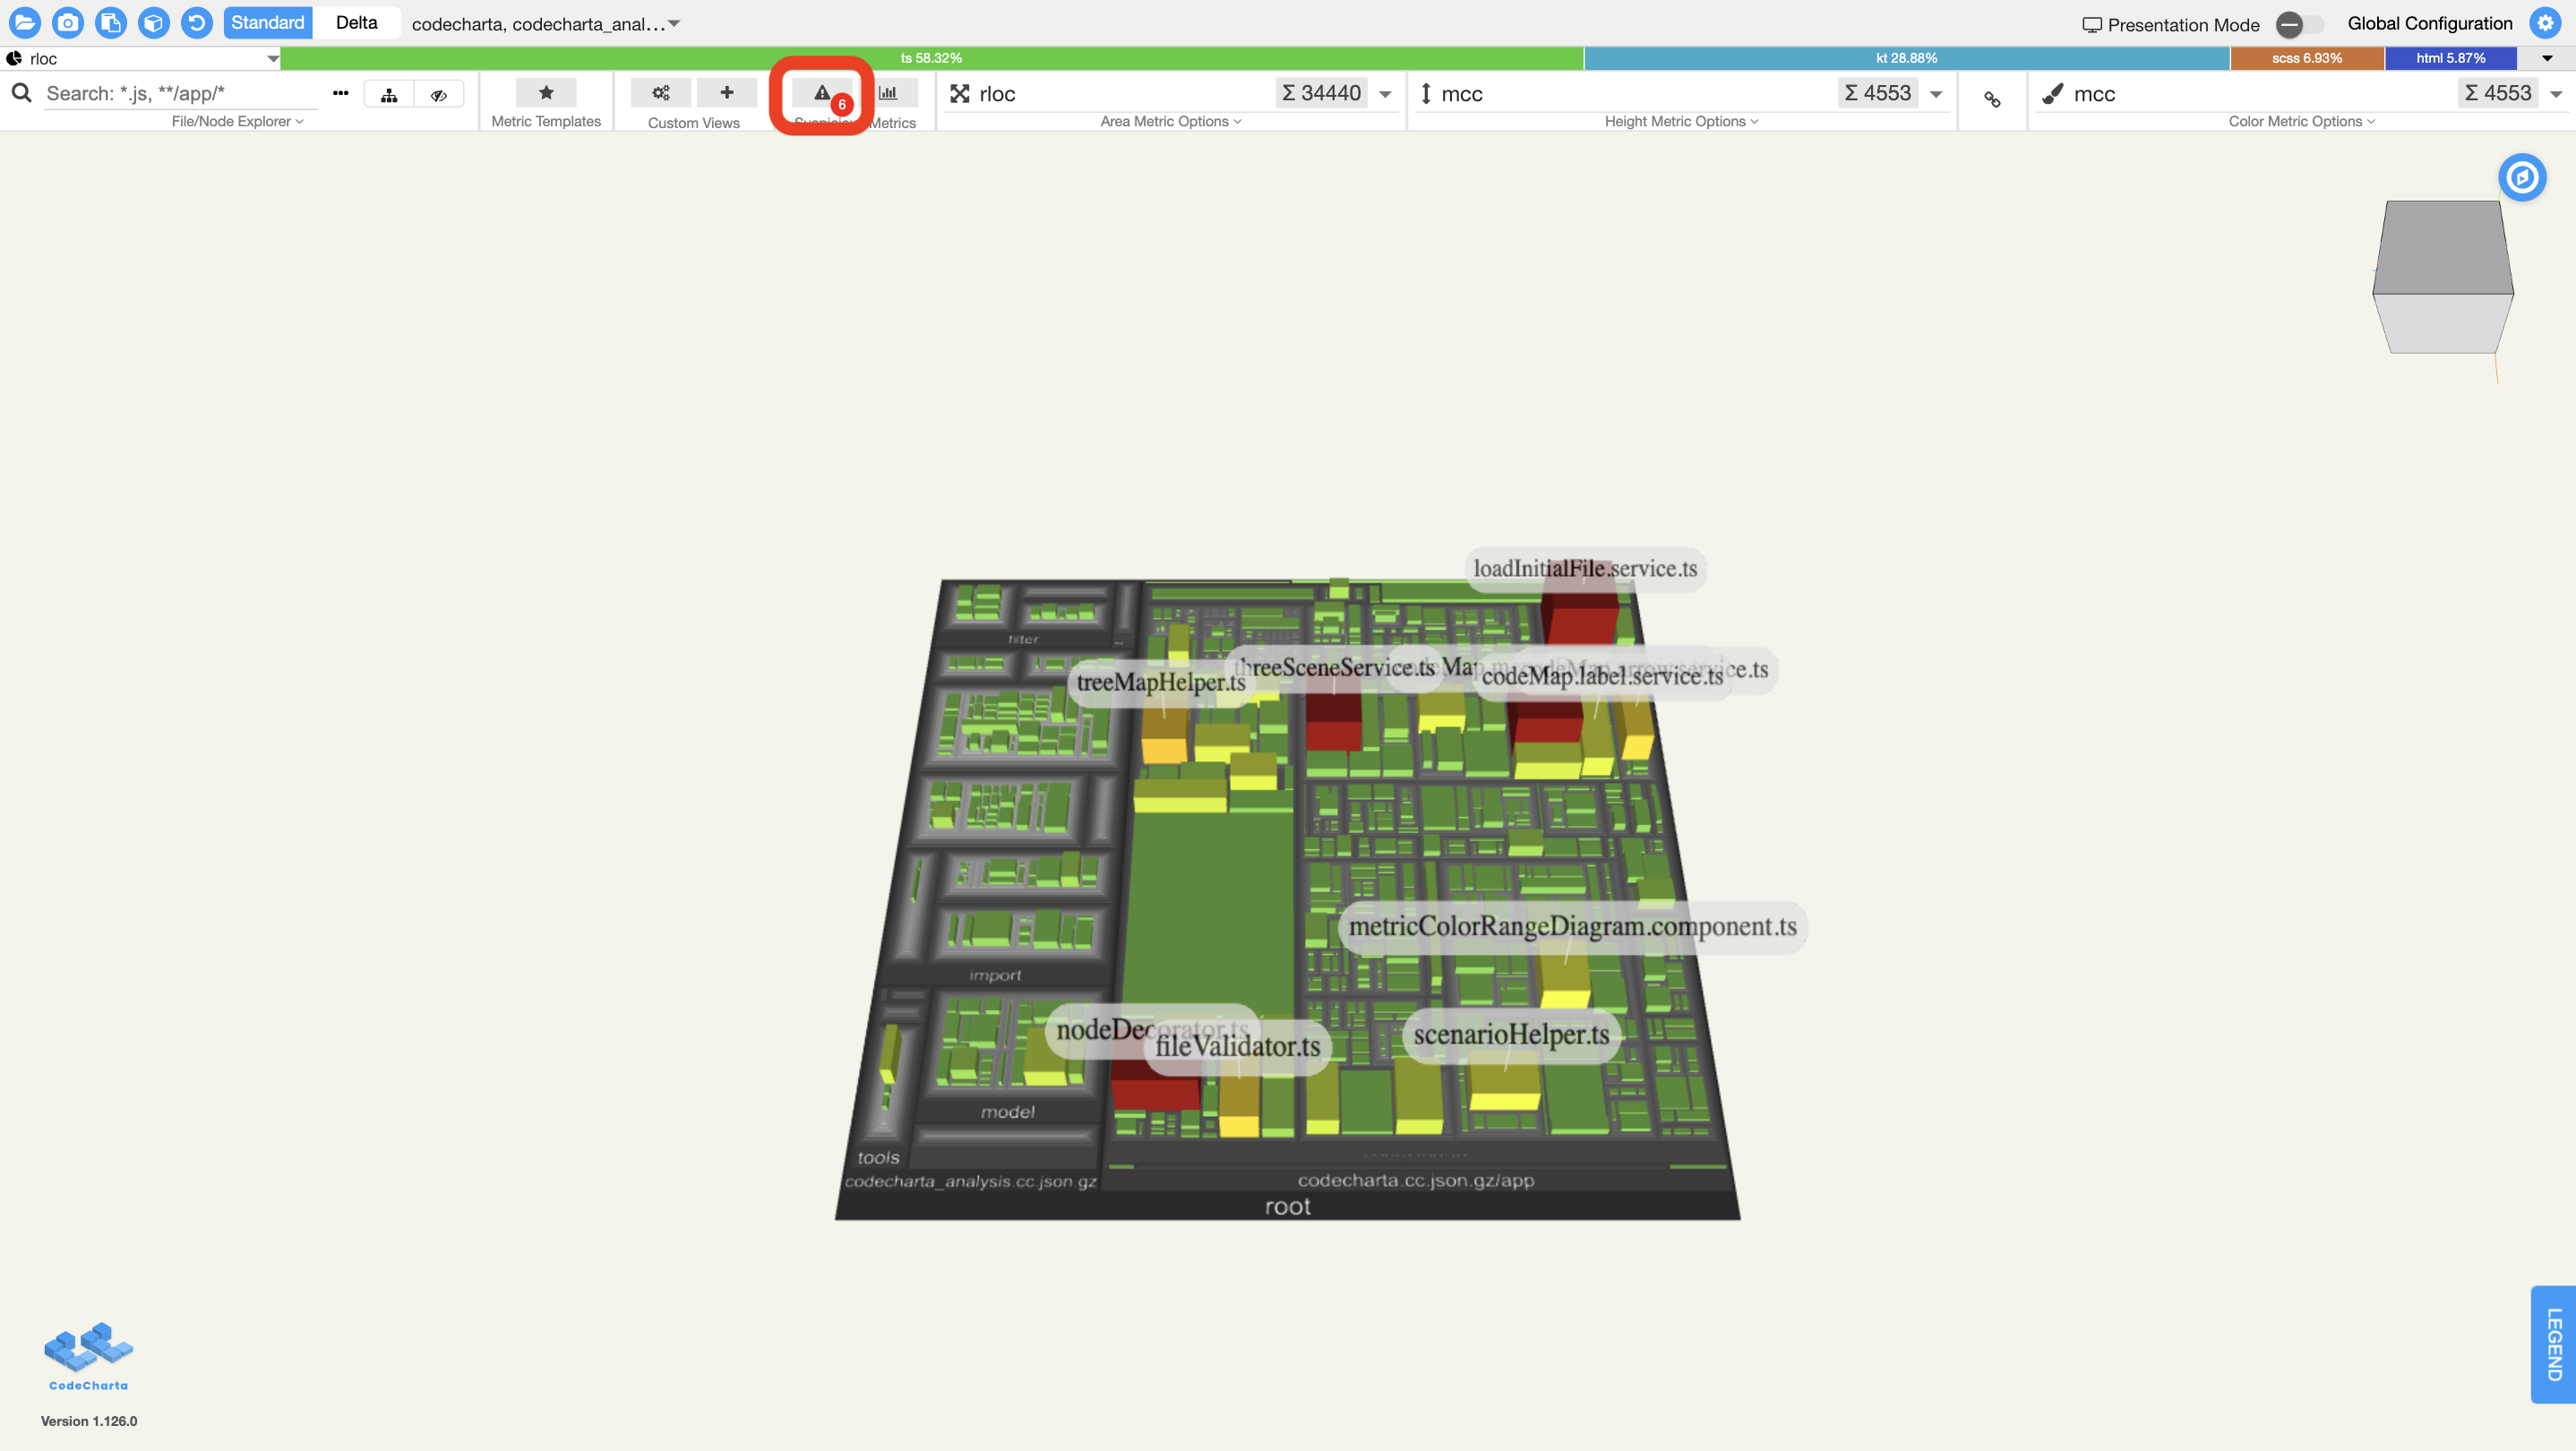
The Suspicious Metrics feature button is the ‘warning’ button in menu bar and shows the number of suspicious metrics found when loading the map (in the above screenshot, six were found). Pressing this button will open the suspicious metrics panel.
This feature will find metrics that are suspiciously high in the loaded cc.json file compared to metric values of 241 Open Source Java projects. Based on this, suspicious, unsuspicious and untracked metrics are identified and can be clicked (see following Screenshot) to automatically view them in the map.
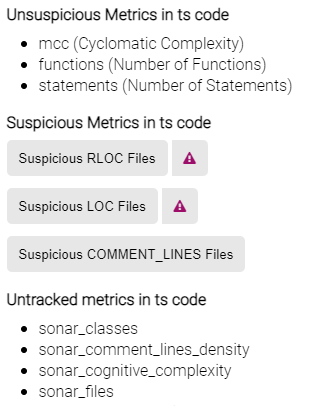
The suspicious metrics in the shown screenshot provide buttons for six metrics to be clicked for visualizing affected code files. Clicking on ‘apply preset’ will load the metric as height and color. Clicking on ‘high risk’ will additonally adjust the maps colors so the high risk files are additionally highlighted. This expresses that there are some files that are considered as outliers in terms of statistically significant high metric values
Be aware that metrics for other programming languages might not be comparable to Java Reference metric values. Though, it can give you a feeling about the code quality in code bases composed with other programming languages. The underlying approach is based on the work of Alves et al.